티스토리 뷰

우리가 이전까지 공부했던 numpy, pandas, 데이터전처리, matplotlib를 총합해서
직접 프로젝트를 진행해보겠습니다 :)

1) 사용할 데이터셋 간단 설명
- 온라인 리테일 사이트의 2010/12-2011/12까지의 주문 기록 데이터
- 약 500,000건의 데이터
2) 라이브러리 불러오기
import numpy as np
import pandas as pd
3) csv 파일 불러오기
retail = pd.read_csv('OnlineRetail.csv')
4) 파일 정보 알아보기
reatil.info()out::::

- 총 541,909개의 entries
# InvoiceNo : 주문번호
# StockCode : 아이템 아이디
# Description : 상품 설명
# Quantity : 상품 주문 수량
# InvoiceDate : 주문 시간
# UnitPrice : 상품 가격
# CustomerID : 고객 아이디
# Country : 고객 거주 지역(국가)
retail.head()out::::

5) 전처리
- 각 필드 당 결측치가 몇 개 있는지 확인
retail.isnull().sum()out::::
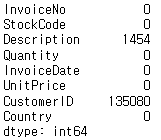
CustormerID에 135,080개의 결측치가 있다고 합니다.
비회원 구매로 인해 결측치로 입력된 것 같으니 비회원 데이터는 제거해주겠습니다.
- 비회원을 제거
retail = retail[pd.notnull(retail['CustomerID'])]
- 구입 수량이 0이상, 구입 가격이 0이상인 데이터만 저장
retail = retail[retail['Quantity'] > 0]
retail = retail[retail['UnitPrice'] > 0]
- 파생 변수 만들기 - 고객의 총 지출비용(CheckoutPrice) = 수량 * 가격
retail['CheckoutPrice'] = retail['UnitPrice'] * retail['Quantity']
- 전처리한 데이터프레임을 csv파일로 저장해두기
retail.to_csv('OnlineRetailClean.csv') # OnlineRetailClean 이름으로 저장

retail = pd.read_csv('OnlineRetailClean.csv') # 다시 retail에 저장
- 날짜 타입 데이터 변환
- 문자열로 데이터를 로딩하는 것보다 datetime 타입으로 로딩하는 것이 날짜 분석 및 계산에 용이
retail['InvoiceDate'] = pd.to_datetime(retail['InvoiceDate'], infer_datetime_format=True)
# infer_datetime_format = Ture: 날짜 시간 포멧을 추정해서 파싱
- Unnamed: 0 열 제거 (불필요한 행)
retail.info()out::::

- InvoiceDate 의 데이터타입이 datetime으로 잘 변환된 것을 확인할 수 있습니다.
- 그런데 불필요한 행인 Unnamed: 0이 생겨서 이 행을 제거해주겠습니다.
retail = retial.drop('Unnamed: 0', axis=1)
6) 데이터 분석
- 전체 매출
total_revenue = retail['CheckoutPrice'].sum()
total_revenue
out::::

- 국가별 매출
rev_by_countries = retail.groupby('Country')['CheckoutPrice'].sum().sort_values()
print(rev_by_countries)
out::::

- 국가별 매출 통계를 plot 그래프로 그리기
# plot이라는 객체 생성
plot = rev_by_countries.plot(kind='bar', figsize=(20,10))

plot.set_xlabel('Country', fontsize=12)
plot.set_ylabel('Revenue', fontsize=12)
plot.set_title('Revenue by Country', fontsize=15)
plot.set_xticklabels(labels=rev_by_countries.index, rotation=45)
out::::

- 국가 매출 비율
rev_by_countries / total_revenueout::::

- 월별 총매출 구하기 & 시각화
일단 데이터들이 어떻게 되어있는지부터 살펴보겠습니다.
retail['InvoiceDate'].sort_values(ascending=False) # 내림차순out::::

우리는 지금 월별 매출이 궁금한 것이기 떄문에 일단 지금은 년,월 이후 데이터는 무의미하겠습니다,
그러므로 다음과 같은 변환을 해줄건데,
예를 들어 2011-12-22 라면 201112 이런식으로 리턴해주는 함수를 정의해보겠습니다.
def extract_month(date):
	month = str(date.month) # date의 month를 추출
    if date.month < 10: # 한 자리 수 달이라면
    	month = '0' + month # 앞에 0을 붙여서 리턴
    return str(date.year) + month #201108 이런 형태로 리턴
rev_by_month = retail.set_index('InvoiceDate').groupby(extract_month).sum()['CheckoutPrice']
# retail.set_index('InvoiceDate')를 인덱스로 삼으면 extract_month함수에 적용가능
rev_by_month # 출력out::::
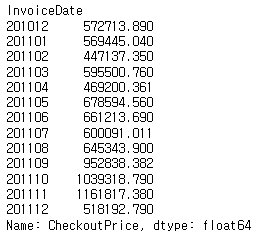
이제 rev_by_month를 plot그래프로 그려보겠습니다.
그 전에, 앞으로 그래프를 계속 그릴 거여서 함수를 먼저 정의해주겠습니다.
def plot_bar(df, xlabel, ylabel, title, figsize=(20, 10), rotation=45):
    plot = df.plot(kind='bar', figsize=figsize)
    plot.set_xlabel(xlabel, fontsize=12)
    plot.set_ylabel(ylabel, fontsize=12)
    plot.set_title(title, fontsize=15)
    plot.set_xticklabels(labels=df.index, rotation=rotation)
plot_bar(rev_by_month, 'Month','Revenue','Revenue by Month')out::::
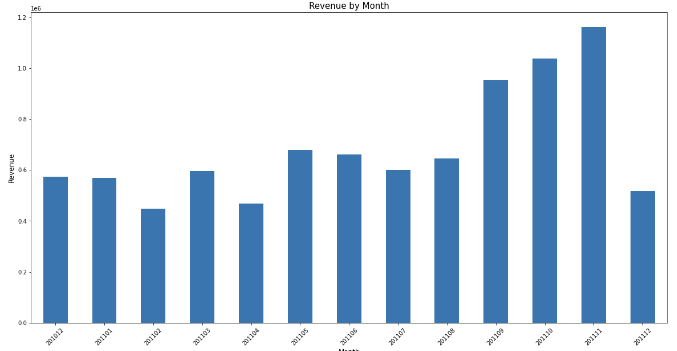
- 요일별 매출 구하기 & 시각화
rev_by_dow = retail.set_index('InvoiceDate').groupby(lambda date:date.dayofweek).sum()['CheckoutPrice']

rev_by_dow # 출력
out::::

이제 rev_by_dow를 시각화 해주겠습니다.
DAY_OF_WEEK = np.array(['Mon','Tue','Wed','Thur','Fri','Sat','Sun'])
rev_by_dow.index = DAY_OF_WEEK[rev_by_dow.index]

plot_bar(rev_by_dow,'DOW','Revenue','Revenue by DOW') # 이전에 정의해둔 함수 사용
out::::

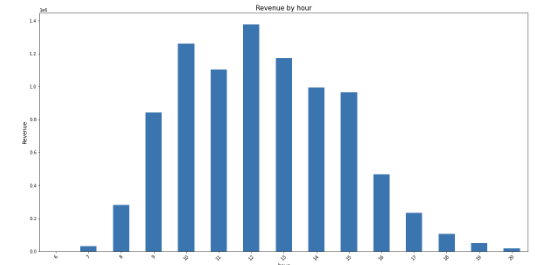
- 시간대별 매출 구하기 & 시각화
rev_by_hour = retail.set_index('InvoiceDate').groupby(lambda date:date.hour).sum()['CheckoutPrice']

rev_by_hour # 출력
out::::
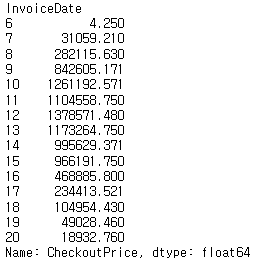
이제 rev_by_hour을 시각화 해주겠습니다.
plot_bar(rev_by_hour, 'hour','Revenue','Revenue by hour')out::::
- 매출 데이터로부터 insight
- 전체 매출의 약 82%가 UK에서 발생
- 11년도 가장 많은 매출이 발생한 달은 11월
- 매출은 꾸준히 급성장(12월 데이터는 모두 포함되지 않음)
- 일주일 중 목요일까지는 성장세, 이후로 하락(토요일에는 영업을 하지 않음)
- 6시에 주문이 시작, 12시까지는 성장세, 오후 3시 이후는 급락
- Top10 판매제품 - Quantity기준
top_seling = retail.groupby('StockCode').sum()['Quantity'].sort_values(ascending=False)[:10]

top_seling # 출력
out::::

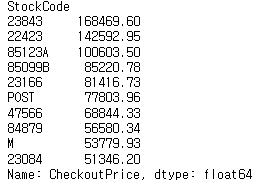
- Top10 판매제품 - CheckoutPrice기준
top_revenue = retail.groupby('StockCode')['CheckoutPrice'].sum().sort_values(ascending=False)[:10]

top_revenue # 출력
out::::
- 우수고객 - 구매 횟수 기준(Quantity기준)
vip = retail.groupby('CustomerID')['Quantity'].count().sort_values(ascending=False)[:10]

vip # 출력
out::::

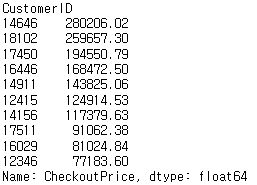
- 우수구객 - 지불 금액 기준(CheckoutPrice기준)
vvip = retail.groupby('CustomerID')['CheckoutPrice'].sum().sort_values(ascending=False)[:10]

vvip # 출력
out::::
- 사용자 기준으로 최초 구매한 월 연산하기 - datetime 활용
최초로 구매한 월을 연산하기 위해 함수를 하나 정의해주겠습니다.
예를 들어, 2011-12-22 -> 2011-12-01 로 변환해주는 즉 모든 일을 1일로 바꿔주는 함수입니다.
def get_month_as_datetime(date):
    # 예를 들어 12월 2일, 12월 13일도 12월 1일로 통일
    return datetime(date.year, date.month, 1)
이제 apply함수를 이용해서 retail의 'InvoiceDate'의 모든 값들을 위에서 정의한 함수에 차례로 들어가게 해서,
새로운 파생변수인 'Month'를 만들어줄 겁니다.
retail['Month'] = retail['InvoiceDate'].apply(get_month_as_datetime)
retail.head()
이제 고객별로 구매한 'Month'값을 모아주고,
가장 작은 값, 가장 처음 구매한 'Month'값을 새로운 파생변수 'MonthStarted'에 저장해줍니다.
month_group = retail.groupby('CustomerID')['Month']
# transform() : 데이터프레임에 그룹단위 통계를 집계
retail['MonthStarted'] = month_group.transform(np.min)
# customer 별로 Month 정보에서 가장 작은 값을 MonthStarted
- 각 구매가 최초 구매로부터 얼마나 월이 지났는지 연산
retail['MonthPassed'] = (retail['Month'].dt.year - retail['MonthStarted'].dt.year) * 12 + \
    (retail['Month'].dt.month - retail['MonthStarted'].dt.month)
월을 가지고만 연산했을 경우, 2011년 2월 - 2010년 12월인 경우 -10이 나와 잘못 연산되게 됩니다.
그러므로, 연도가 다를경우 12개월을 뜻하는 12를 곱해서 즉 2011 2월 - 2010년 12월인 경우
우선 연도가 다르므로 12 +
2월 - 12월 = -10
= 2개월
2010년 12월이 최초 구매일이고 이후 구매일이 2011년 2월 즉 최초 구매일로 부터 2개월이 지난 것이므로 연산이 맞게 되겠죠?

여기까지 쇼핑몰 고객주문 데이터 프로젝트 실습을 직접 해보았습니다 :)
'빅데이터 인공지능 > 데이터분석' 카테고리의 다른 글
| [데이터분석] ⑧ 셀레니움(Selenium) (0) | 2022.07.11 |
|---|---|
| [데이터분석] ⑦ 스크레이핑(Scraping) (0) | 2022.07.09 |
| [데이터분석] ⑤ matplotlib 라이브러리 (0) | 2022.06.28 |
| [데이터분석] ④ 데이터 전처리 활용 및 수행 (0) | 2022.06.27 |
| [데이터분석] ③ 기본적인 pandas 모듈(2) (0) | 2022.06.27 |
- Total
- Today
- Yesterday
- 파이썬
- 머신러닝
- jest
- react
- frontend
- 프론트엔드 기초
- 타입스크립트
- 자바스크립트 기초
- TypeScript
- 리액트 훅
- CSS
- 자바
- rtl
- 프론트엔드
- 프로젝트 회고
- 인프런
- testing
- Python
- HTML
- 프론트엔드 공부
- 자바스크립트
- 딥러닝
- 디프만
- 스타일 컴포넌트 styled-components
- styled-components
- JSP
- 리액트
- 데이터분석
- react-query
- next.js
| 일 | 월 | 화 | 수 | 목 | 금 | 토 |
|---|---|---|---|---|---|---|
| 1 | 2 | 3 | ||||
| 4 | 5 | 6 | 7 | 8 | 9 | 10 |
| 11 | 12 | 13 | 14 | 15 | 16 | 17 |
| 18 | 19 | 20 | 21 | 22 | 23 | 24 |
| 25 | 26 | 27 | 28 | 29 | 30 | 31 |
